
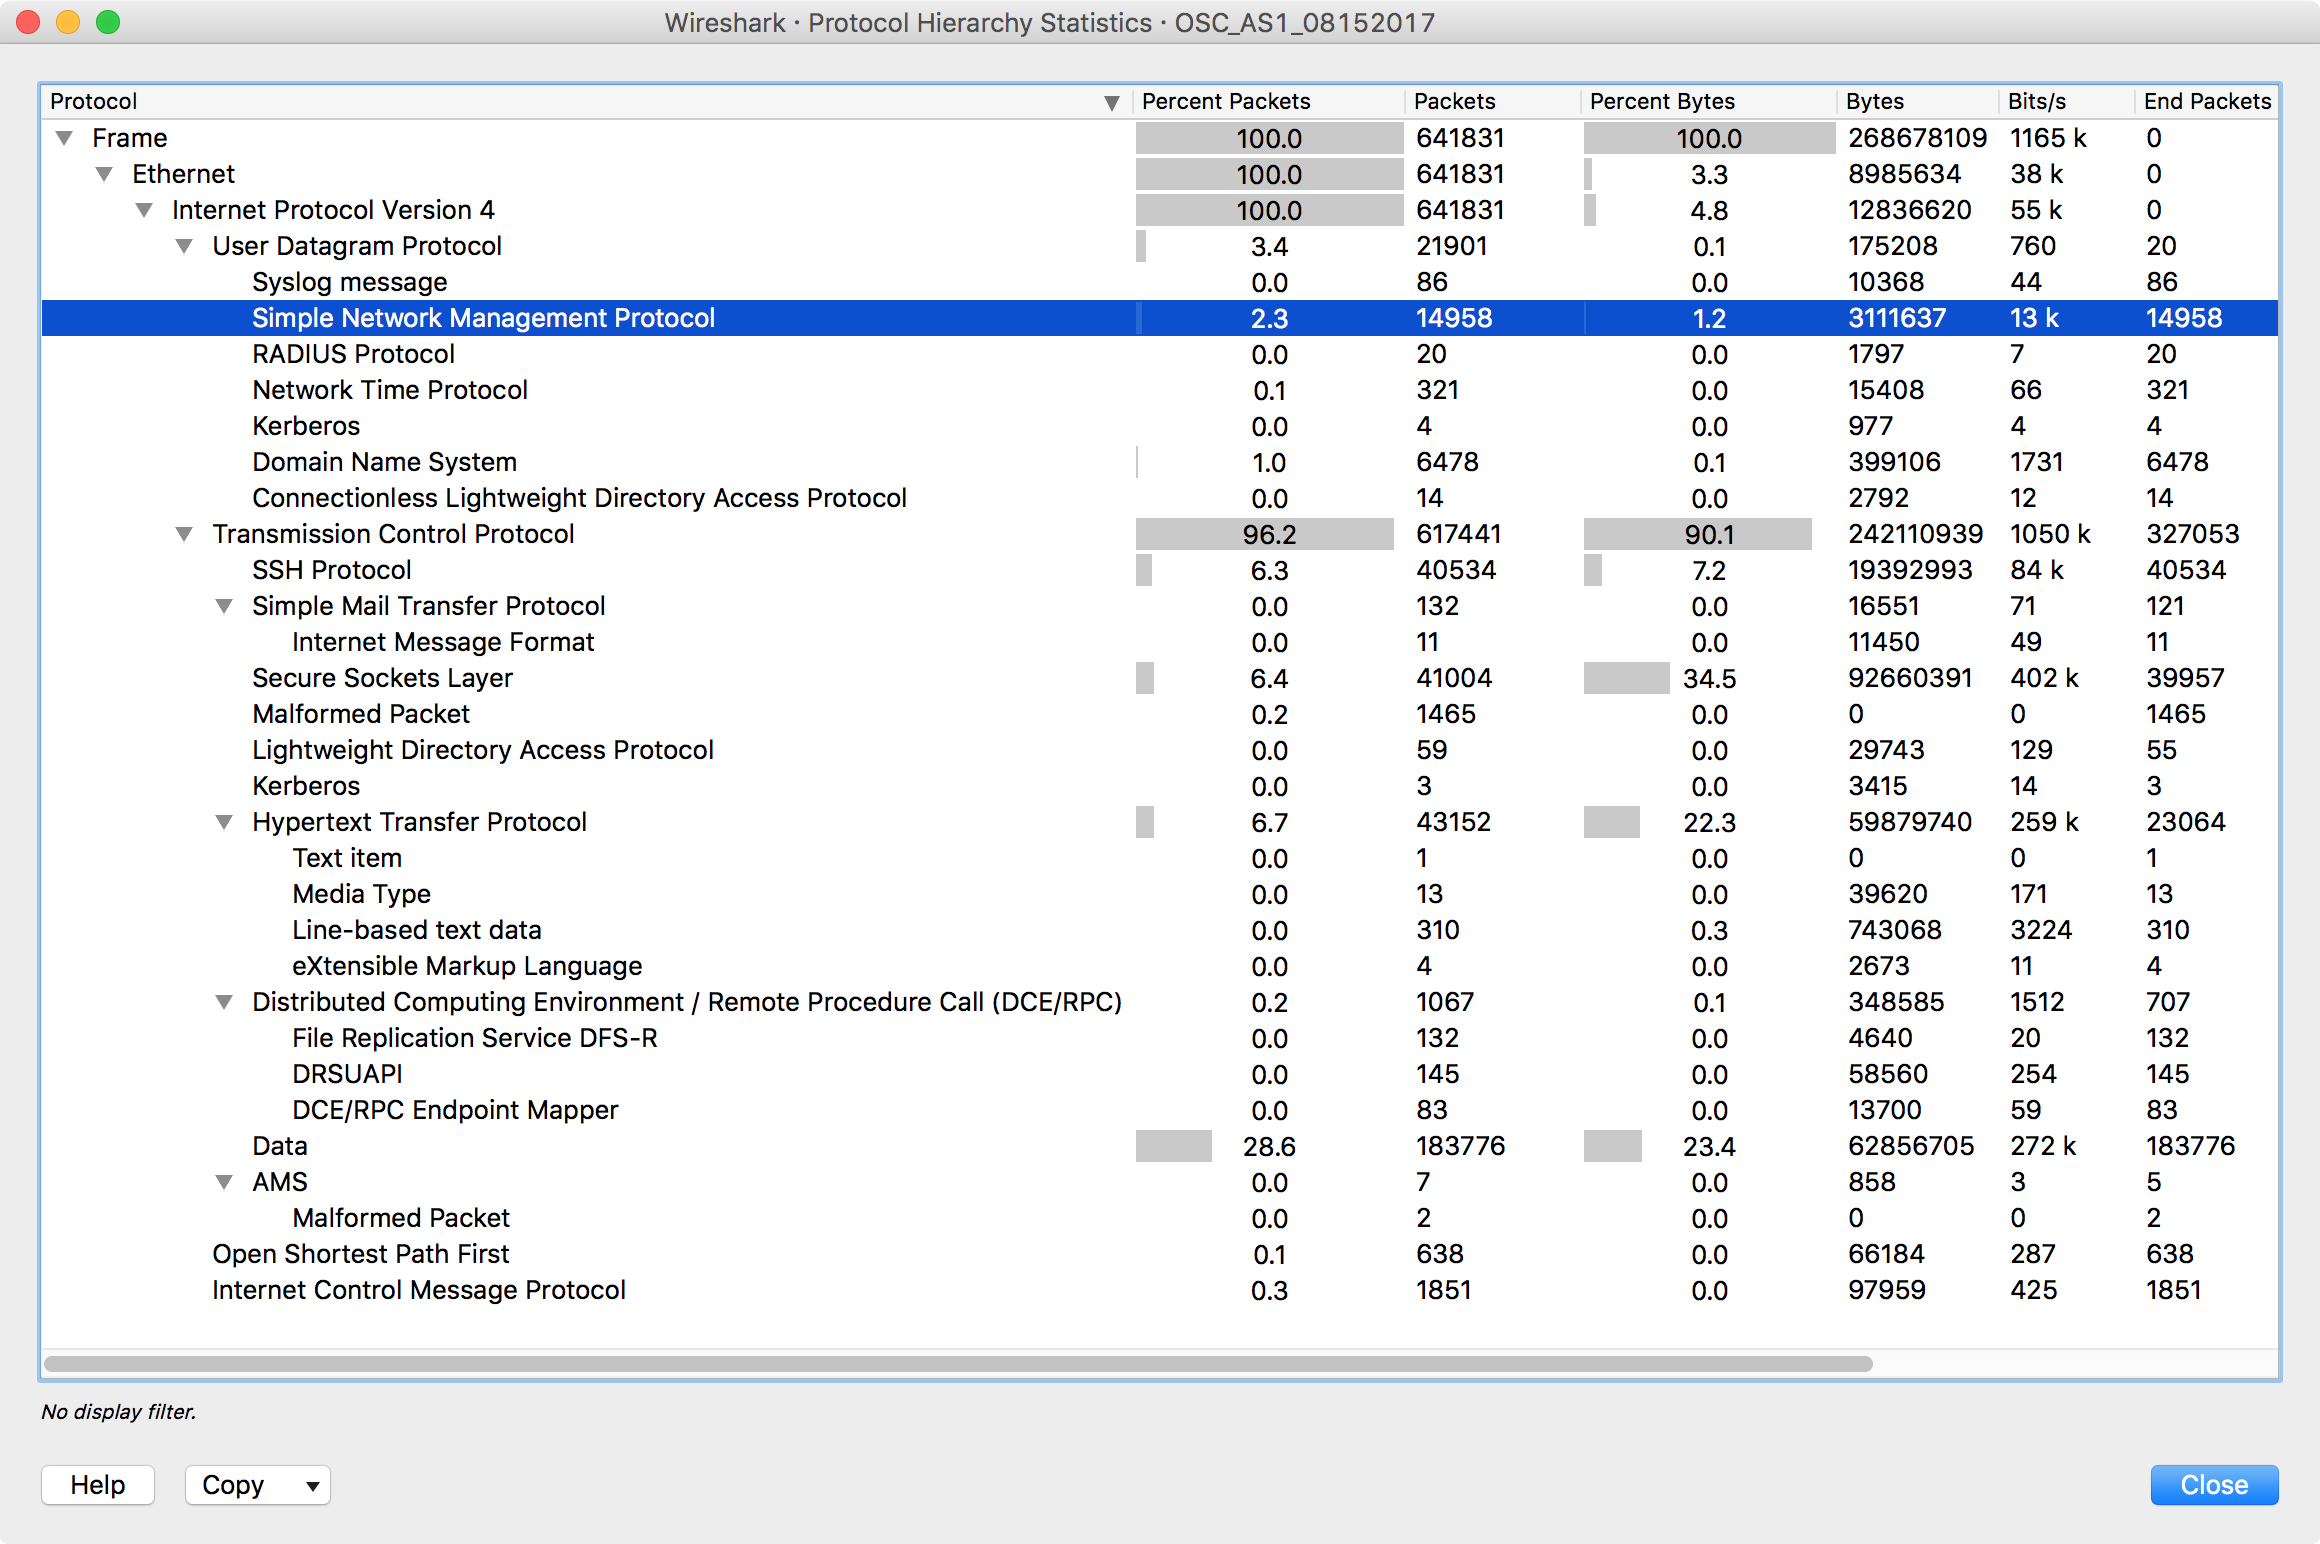
The free and open source packet analysis tool Wireshark provides many capabilities for analyzing network traffic. Among its capabilities is the capability to provide statistical information regarding captured network traffic. Looking at a pcap file with Wireshark for traffic captured during a data flow test, I saw what seemed to be a fair amount of Simple Network Management Protocol (SNMP) and Secure Shell (SSH) traffic with systems on an external network. I wanted to determine the actual percentage that traffic represented within the overall traffic during the test period. Fortunately, that is easy to do within Wireshark. One way to view statistics on bandwidth utilization by protocol while viewing captured data is by clicking on Statistics then selecting Protocol Hierarchy. Note: you may need to wait a little while for the statistics to be displayed if the amount of data to be processed is large.
Protocol hierarchy columns
- Protocol
- This protocol’s name
- Percent Packets
- The percentage of protocol packets relative to all packets in the capture
- Packets
- The total number of packets of this protocol
- Percent Bytes
- The percentage of protocol bytes relative to the total bytes in the capture
- Bytes
- The total number of bytes of this protocol
- Bits/s
- The bandwidth of this protocol relative to the capture time
- End Packets
- The absolute number of packets of this protocol where it was the highest protocol in the stack (last dissected)
- End Bytes
- The absolute number of bytes of this protocol where it was the highest protocol in the stack (last dissected)
- End Bits/s
- The bandwidth of this protocol relative to the capture time where was the highest protocol in the stack (last dissected)
Packets usually contain multiple protocols. As a result more than one protocol will be counted for each packet.
Protocol layers can consist of packets that won’t contain any higher layer protocol, so the sum of all higher layer packets may not sum up to the protocols packet count. This can be caused by continuation frames, TCP protocol overhead, and other undissected data.
A single packet can contain the same protocol more than once. In this case, the protocol is counted more than once. For example ICMP replies and many tunneling protocols will carry more than one IP header.
In the example above, I can see that the SNMP transmissions, which are via the User Datagram Protocol (UDP), were only about 2.3% of the network traffic with a bandwidth of only 13 kbs. The SSH transmissions, which use the Transmission Control Protocol (TCP), were only about 6.3% of network traffic during the period data was captured and used only about 84 kbs of bandwidth.
You can copy that data to a
comma-separated
values (CSV) file by clicking on Copy at the bottom of the
Protocol Hierarchy Statistics window and choosing "as CSV". Then
open a text file and paste the data into it. You can then save the data to
a file with a .csv
filename extension, which will allow you to open the file with
Microsoft Excel or
another application that can view CSV files. As an example, the data
displayed in the above screen shot is in
protocol_hierarch.csv. If you open the file in Excel or another
spreadsheet program, such as the free
Apache OpenOffice Calc or
LibreOffice Calc applications, you can then sum the Bits/s field with
a formula such as =SUM(F2:F34 / 1000 / 1000 to determine the
total bandwidth used in
megabit per second (Mbs).
You can also obtain statistics on protocol usage from a pcap file by using
the command-line
interface (CLI) tshark application that comes with Wireshark.
E.g., examining the same pcap file with tshark -qz io,phs shows
the following:
$ tshark -qz io,phs -r ~/Documents/Work/Testing/OSC_AS1_08152017

===================================================================
Protocol Hierarchy Statistics
Filter:

eth                                      frames:641831 bytes:268678109
  ip                                     frames:641831 bytes:268678109
    udp                                  frames:21901 bytes:4462287
      snmp                               frames:14958 bytes:3739873
      dns                                frames:6478 bytes:671182
      ntp                                frames:321 bytes:28890
      syslog                             frames:86 bytes:13980
      cldap                              frames:14 bytes:3380
      radius                             frames:20 bytes:2637
      kerberos                           frames:4 bytes:1145
    tcp                                  frames:617441 bytes:263964245
      ssl                                frames:21967 bytes:45475566
        tcp.segments                     frames:1850 bytes:4636101
          ssl                            frames:1277 bytes:4032566
          data                           frames:5 bytes:13362
      data                               frames:183476 bytes:73245824
      ssh                                frames:40541 bytes:21594443
        tcp.segments                     frames:2 bytes:364
      tcp.segments                       frames:234 bytes:339226
      http                               frames:42699 bytes:52043499
        data-text-lines                  frames:310 bytes:316240
          tcp.segments                   frames:306 bytes:313572
        ssl                              frames:19014 bytes:20801414
          tcp.segments                   frames:802 bytes:613463
            http                         frames:788 bytes:597398
              ssl                        frames:786 bytes:594886
              data                       frames:2 bytes:2512
        media                            frames:13 bytes:16344
          tcp.segments                   frames:13 bytes:16344
        tcp.segments                     frames:9 bytes:6932
        xml                              frames:4 bytes:3239
          tcp.segments                   frames:2 bytes:1118
        data                             frames:293 bytes:371158
        text                             frames:1 bytes:1012
      ldap                               frames:55 bytes:21789
        tcp.segments                     frames:4 bytes:640
          ldap                           frames:4 bytes:640
      ams                                frames:7 bytes:1320
        _ws.malformed                    frames:2 bytes:206
      dcerpc                             frames:1067 bytes:404743
        epm                              frames:83 bytes:21758
        frstrans                         frames:132 bytes:27048
        tcp.segments                     frames:1 bytes:573
        drsuapi                          frames:145 bytes:82050
      _ws.malformed                      frames:1465 bytes:281494
      smtp                               frames:132 bytes:25263
        imf                              frames:11 bytes:759
      kerberos                           frames:3 bytes:2165
        tcp.segments                     frames:1 bytes:173
    ospf                                 frames:638 bytes:87876
    icmp                                 frames:1851 bytes:163701
===================================================================
$
The options to the command in the example above are as follows:
  -r <infile>              set the filename to read from (- to read from stdin)
  -q                       be more quiet on stdout (e.g. when using statistics)
  -z <statistics>          various statistics, see the man page for details
You can see other options available with the tool by typing
tshark --help at the command prompt.
The output contains only the number of frames and the number of bytes per protocol. In the example above, though the frame counts match for SNMP and differ by only 7 packets for SSH in both the Wireshark and tshark output, the number of bytes differ substantially for both, though.
| Protocol | Wireshark | Tshark | Difference |
|---|---|---|---|
| SNMP | 3,111,637 | 3,739,873 | 628,236 |
| SSH | 19,392,993 | 21,594,443 | 2,201,450 |
That is because Wireshark is displaying the bytes per packet whereas tshark is displaying information not by packet, but by frame, i.e., the numbers include the Ethernet frame overhead, i.e., an additional 42 bytes. The Ethernet frame encapsulates the UDP datagrams and TCP packets. For the 14,958 frames for SNMP that is 42 bytes * 14,958 bytes/frame = 628,236 bytes. The 42 octets/bytes are allocated in the Ethernet frame as follows:
| Description | Bytes |
|---|---|
| Preamble | 7 |
| Start of frame delimiter | 1 |
| MAC destination | 6 |
| MAC source | 6 |
| 802.1Q tag (optional) | 4 |
| Ethertype (Ethernet II) or length (IEEE 802.3) | 2 |
| Frame check sequence (32‑bit CRC) | 4 |
| Interpacket gap | 12 |
The payload within the frame, e.g. a packet's contents, which is located between the Ethertype and frame check sequence fields, can be from 46 to 1500 bytes.
I can also get statistics by network port using commands like the ones shown below:
$ tshark -qz 'io,stat,0,udp.port==161'  -r ~/Documents/Work/Testing/OSC_AS1_08152017

=======================================
| IO Statistics                       |
|                                     |
| Duration: 1843.5 secs               |
| Interval: 1843.5 secs               |
|                                     |
| Col 1: udp.port==161                |
|-------------------------------------|
|                  |1                 |
| Interval         | Frames |  Bytes  |
|-------------------------------------|
|    0.0 <> 1843.5 |  14954 | 3739237 |
=======================================
$ tshark -qz 'io,stat,0,udp.port==162'  -r ~/Documents/Work/Testing/OSC_AS1_08152017

=====================================
| IO Statistics                     |
|                                   |
| Duration: 1843.5 secs             |
| Interval: 1843.5 secs             |
|                                   |
| Col 1: udp.port==162              |
|-----------------------------------|
|                  |1               |
| Interval         | Frames | Bytes |
|-----------------------------------|
|    0.0 <> 1843.5 |      4 |   636 |
=====================================
$
I can see from the above output that the numbers displayed for SNMP in Wireshark
included both SNMP queries and responses for UDP port 161, but also for
SNMP traps on UDP port 162, since the packet count for SNMP in Wireshark
is 14,958 and the frame count in the tshark output shows 14,954 frames for
port 161, the
well-known port for SNMP, and 4 for port 162. I could get a
combined report for both ports by using a logical "or" condition, i.e,
udp.port==161 or upd.port==162 as shown below:
$ tshark -qz 'io,stat,0,udp.port==161 or udp.port==162'  -r ~/Documents/Work/Testing/OSC_AS1_08152017

=========================================
| IO Statistics                         |
|                                       |
| Duration: 1843.5 secs                 |
| Interval: 1843.5 secs                 |
|                                       |
| Col 1: udp.port==161 or udp.port==162 |
|---------------------------------------|
|                  |1                 | |
| Interval         | Frames |  Bytes  | |
|-------------------------------------| |
|    0.0 <> 1843.5 |  14958 | 3739873 | |
=========================================
$
Related articles:
References:


