
You can use the top command to view CPU usage from a Terminal window (the Terminal program can be found in
Applications/Utilities). If you use the -o
cpu option, i.e., top -o cpu, you can order the
list of processes displayed by the command so that the one with the
greatest CPU usage appears at the top of the list. In the example
below, WebProcess, which is Safari, is consuming 20.5%
of the CPU cycles.
Processes: 139 total, 4 running, 6 stuck, 129 sleeping, 740 threads     12:22:48
Load Avg: 0.89, 1.22, 1.08  CPU usage: 13.91% user, 8.69% sys, 77.39% idle
SharedLibs: 15M resident, 1896K data, 0B linkedit.
MemRegions: 49593 total, 2147M resident, 37M private, 420M shared.
PhysMem: 777M wired, 1656M active, 1601M inactive, 4034M used, 61M free.
VM: 308G vsize, 1052M framework vsize, 3310446(0) pageins, 2444780(0) pageouts.
Networks: packets: 2528294/1382M in, 2608203/1376M out.
Disks: 2497190/42G read, 1710449/41G written.

PID    COMMAND      %CPU TIME     #TH  #WQ  #POR #MREGS RPRVT  RSHRD  RSIZE
12190  WebProcess   20.5 02:30.21 22/1 7    400  20938  1582M  138M   1962M
12250  top          11.8 00:01.45 1/1  0    24   30     1320K  216K   2068K
10774  firefox      3.3  06:48.60 49   1    215  1056   57M    56M    72M
12188  Safari       2.8  00:25.59 17   3    282  2125   70M    50M    146M
0      kernel_task  1.6  48:31.32 82/2 0    2    616    25M    0B     402M
122    WindowServer 1.4  35:54.45 4    1    659- 6934-  17M-   199M   127M-
321    distnoted    0.6  19:37.98 5    4    137  47     3588K  2060K  3984K
475    Terminal     0.4  01:49.13 6    2    188- 423-   19M-   14M    41M-
24     distnoted    0.2  08:16.24 5    4    118  45     952K   2060K  1296K
59     hidd         0.2  04:37.13 4    2    84   62     452K   320K   1220K
478-   AdobeReader  0.2  08:51.76 10   3    147  285    1508K  8360K  2996K
74-    LANrev Agent 0.1  02:55.87 13   2    121  90     684K   2100K  1732K
72-    dsAccessServ 0.1  06:24.82 23   4    159- 218-   1476K- 2468K  2484K-
1164-  Timbuktu Hos 0.0  03:00.73 4    1    106  173    548K   6248K  1636K
60     fseventsd    0.0  01:00.23 75   1    287  192    1552K  216K   2064K
1918-  Microsoft Ex 0.0  15:26.41 5    2    162  1801   38M    62M    96M
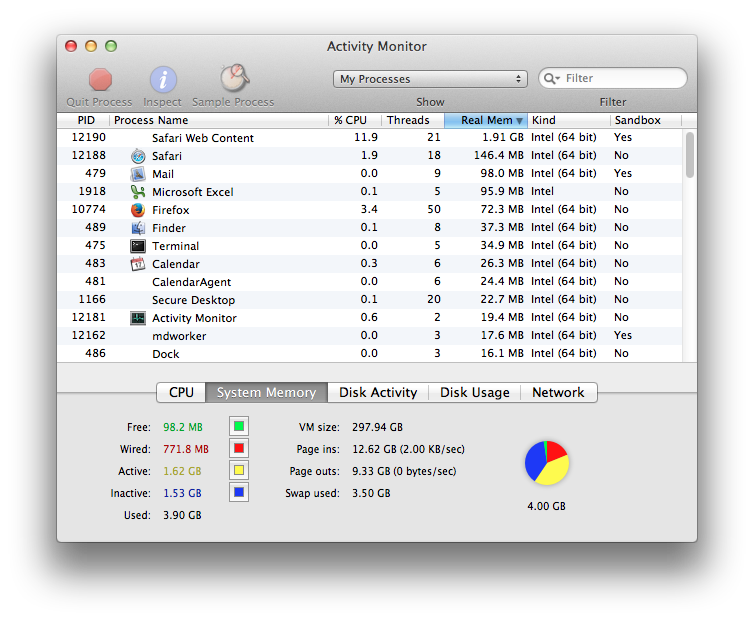
You can also use the Activity Monitor program found in
Appliclation/Utilities to check on the memory and CPU usage on
an OS X system. If you click on a column header, e.g. Real Mem or
% CPU, you can order the list of processes by that column.
But how do you determine which tab in Safari may be using the most memory or CPU cycles? With Safari 6.1 or later, you can enable the debug menu to obtain more detailed information regarding Safari's performance. From a shell prompt, aka command line interface (CLI), e.g., a Terminal window, you can issue the command below:
defaults write com.Apple.Safari IncludeInternalDebugMenu -bool true
To see the debug menu, if you had Safari open before you issued the command, you will need to quit Safari and reopen it. You should then see Debug appear in Safari's menu bar at the top of the Safari window to the right of Window and Help. Click on Debug then select User Per-Tab Web Processes. You will see the message below when you do so:
|
|
Are you sure you want to switch to per- tab web processes?
This requires quitting and relaunching Safari. I'll do |
Click on the "Switch and Quit" button, which will cause Safari to close, so you will need to reopen it afterwards, but you should be able to restore the tabs from the prior session. If you click on Safari from Safari's menu bar and then select Preferences, under the General tab, you can select "All windows from last session" for the value for "Safari opens with" prior to taking the step to switch to per-tab web processes, then when you reopen Safari all of your prior tabs will open automatically.
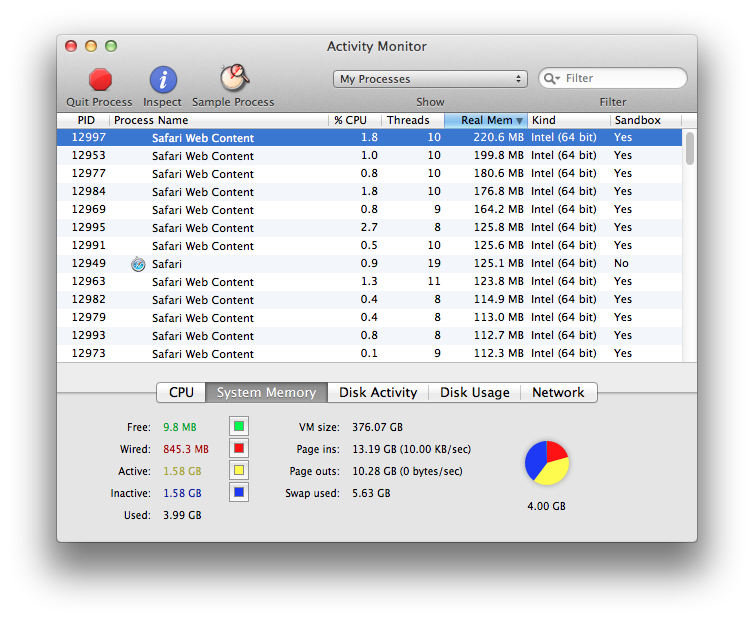
After you take the above step, the Activity Monitor application will display a process id (PID) for each tab open in Safari.
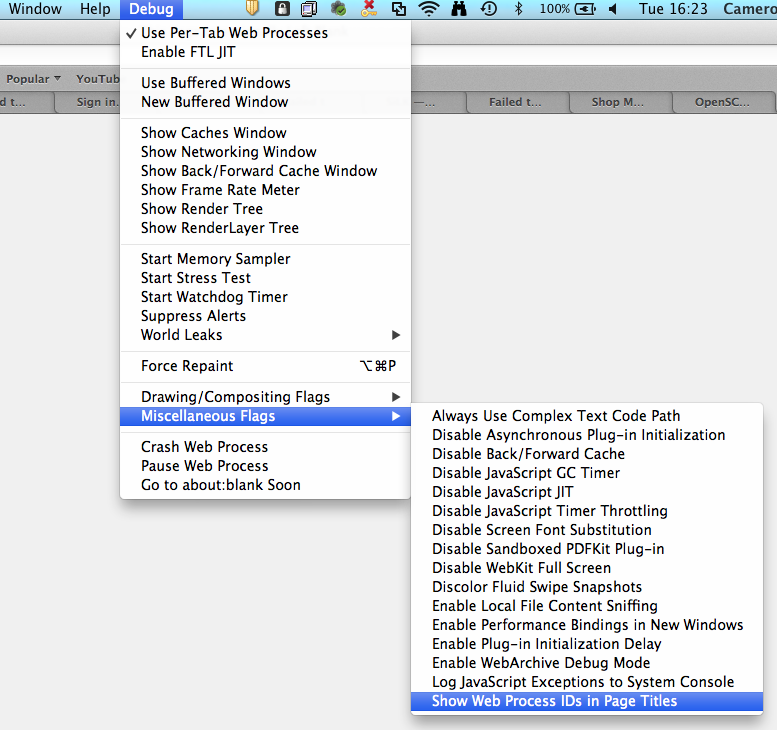
Then click on Debug from Safari's menu bar again and select Miscellaneous Flags then Show Web Process IDs in Page Titles.
Then, when you restart Safari, if you check the tabs, you will see a PID
in the title. E.g., "Welcome Back [WP 13320]" where "WP" represents "WebProcess"
and 13320 is the pid. You can then use Activity Monitor or the
top command to see which tab is consuming the most memory or CPU
cycles. If you use top -o cpu , you will see output
similar to the following:
Processes: 154 total, 3 running, 8 stuck, 143 sleeping, 915 threads     16:49:18
Load Avg: 6.83, 4.65, 3.86  CPU usage: 21.13% user, 13.82% sys, 65.4% idle
SharedLibs: 7008K resident, 920K data, 0B linkedit.
MemRegions: 65080 total, 2575M resident, 45M private, 415M shared.
PhysMem: 848M wired, 1618M active, 1618M inactive, 4085M used, 9976K free.
VM: 368G vsize, 1052M framework vsize, 3503918(83) pageins, 2826337(2609) pageout
Networks: packets: 3174722/1913M in, 3233746/1559M out.
Disks: 2810028/46G read, 1939931/46G written.

PID    COMMAND      %CPU TIME     #TH  #WQ  #PORT #MREG RPRVT  RSHRD  RSIZE
13346  WebProcess   20.6 00:09.39 10   3    193   1490+ 117M+  46M    142M+
13481  top          15.5 00:02.02 1/1  0    25    30    1392K  216K   2140K
13340  WebProcess   3.7  00:23.83 10   3    159   2701  175M+  40M    212M+
10774  firefox      3.3  15:42.85 50   1    216   1104  47M-   64M    72M
0      kernel_task  2.8  54:24.39 82/2 0    2     799-  27M-   0B     424M-
13352  WebProcess   1.8  00:25.70 11   4    196   3516  190M-  44M    222M+
13238  GIMP-bin     1.6  00:39.16 9    2    137-  398-  35M-   12M    58M-
13342  WebProcess   1.3  00:05.41 10   3    193+  1273+ 76M+   45M    100M+
122    WindowServer 1.3  41:48.57 4    1    768-  7559- 12M-   197M+  100M-
13354  WebProcess   1.3  00:15.05 8    1    191   2327+ 122M+  47M    149M+
13320  WebProcess   1.3  00:17.08 11   3    167   1823- 105M-  61M    143M-
13348  WebProcess   1.2  00:17.16 9    2    163   1434+ 81M+   76M+   112M+
13312  NetworkProce 1.1  00:40.26 11   8    145   281-  27M-   13M    64M-
321    distnoted    0.9  21:41.06 5    4    175   48    5064K  732K   5204K
13338  WebProcess   0.9  00:06.38 10   3    158+  800+  36M-   46M    59M+
13309  Safari       0.9  00:27.09 18   4    334   2178  57M-   22M    99M
13322  WebProcess   0.9  00:07.98 10   3    157   938+  52M+   57M    76M+
You can close the tab with the relevant PID by selecting it in Safari and then hitting command-W, which closes a tab in Safari and other browsers under OS X.
Or you can kill the process associated with the tab that is causing problems, by clicking on the process with the relevant proces id to select it in the Activity Monitor.

Then click on the Quit Process icon. You will then see the message below:

|
Are you sure you want to quit this process?
Do you really want to quit "Safari Web Content"? |
Click on Quit or Force Quit to terminate the process
causing a performance issue, which should close just that tab, but not
others open in Safari. However, if you click on either Quit
or Force Quit, Safari may then reopen the tab with another
process id with the message "A problem occurred with this webpage so it was
reloaded." The same thing will happen if you kill the process from the
command line, e.g., kill -HUP 18127. But forcing it to reopen
in that manner may result in a new process that is using less CPU cycles
and memory, which you can terminate, if you wish, by selecting the tab
and then hitting command-W to close the Safari tab under OS X.
Note: tested on Safari 6.2.8 on OS X 10.8.5 (Mountain Lion)
![]()
Created: Tuesday September 22, 2015