
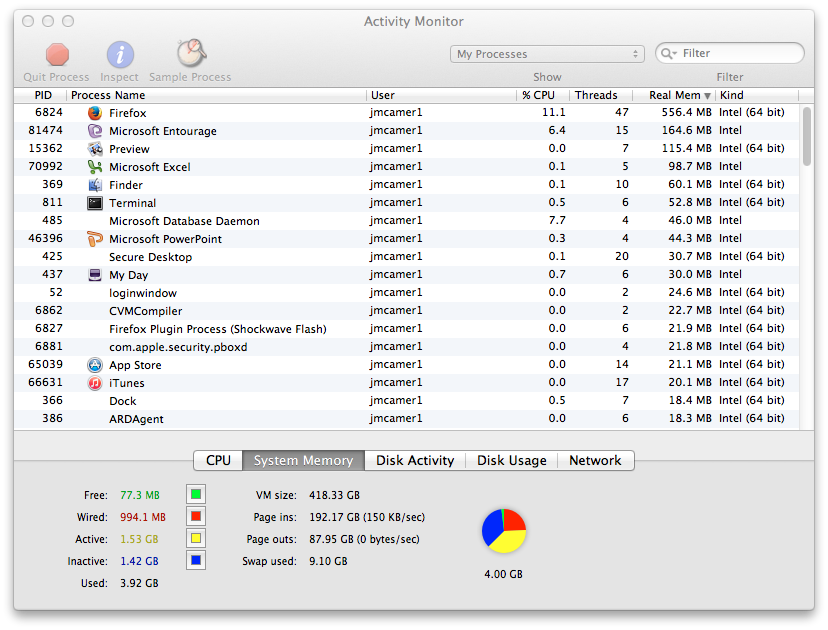
You can also see the amount of free memory for the system listed near the bottom of the window and how that compares to available memory in the pie chart displayed near the bottom of the window.
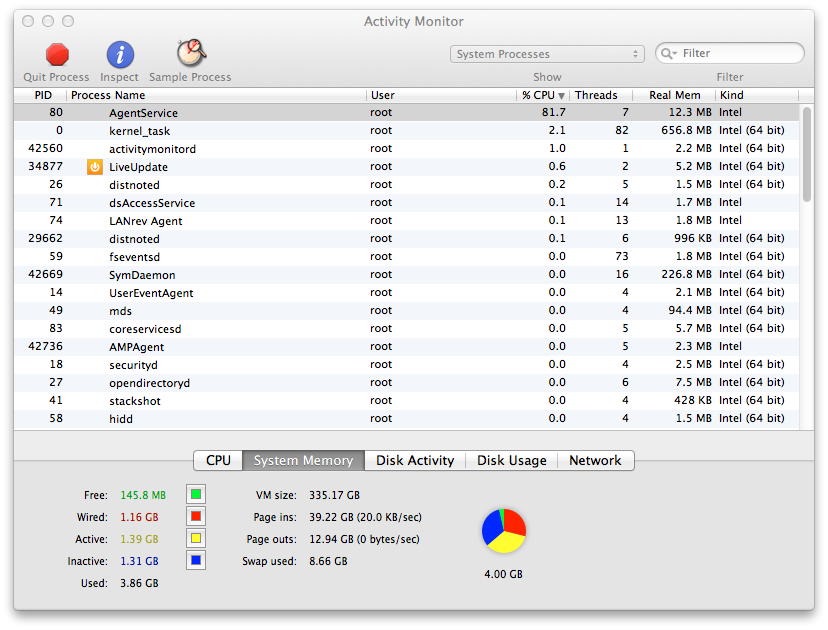
By default, Activity Monitor shows user processes, but you can show system processes, instead. by selecting "System Processes" rather than "My Processes" from the dropdown menu at the top of the window. E.g., the example below shows system processes ordered by CPU utilization with that ordering done by clicking on the % CPU column header.
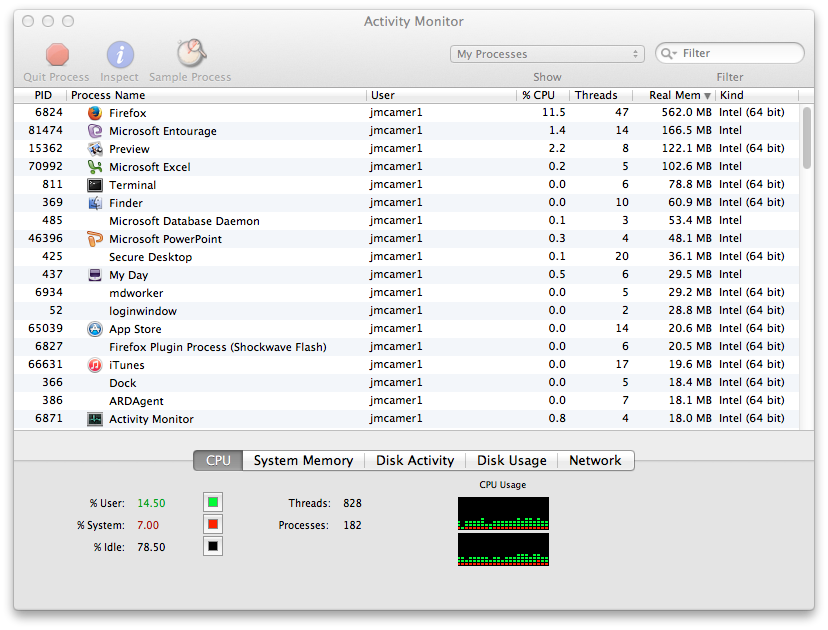
If you would like to see a graph of how CPU usage is changing over time, you can click on CPU near the bottom of the window, which will show you a continually updating graph.
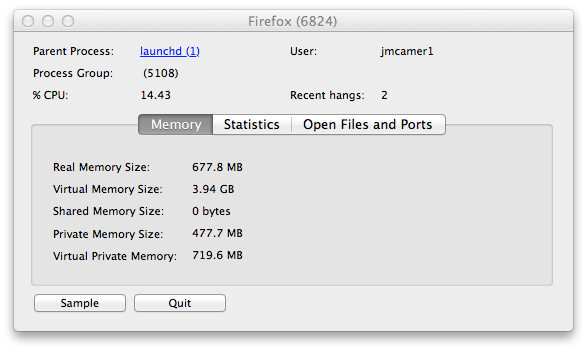
If you would like further details on a particular process, you can double-click on the line where the process appears to see further information on that process. E.g., double-clicking on Firefox shows the following statistics, such as CPU Time, for the process:
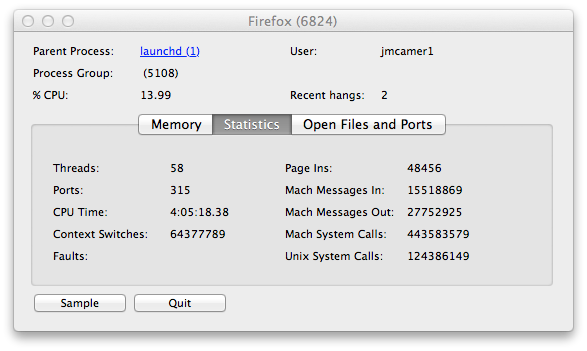
Clicking on the Memory tab on that window will show more details on memory utilization by the process, e.g., real memory size, virtual memory size, shared memory size, private memory size, and virtual private memory.
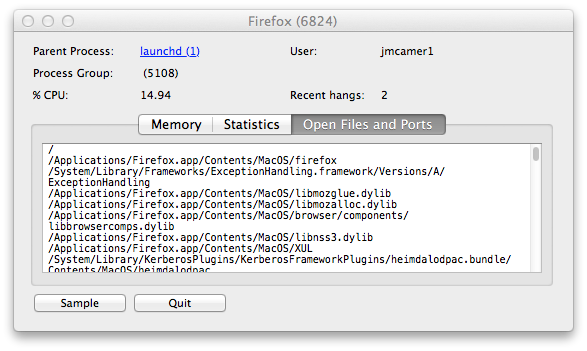
Clicking on the Open Files and Ports tab will show files and ports opened by the process.
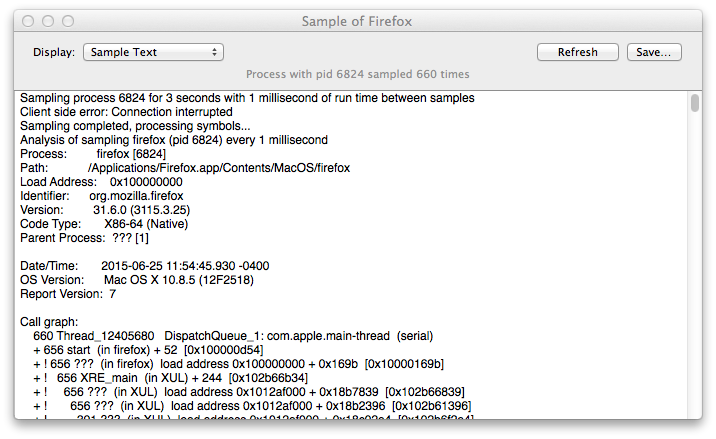
If you click on the Sample button, you will see something like the following:
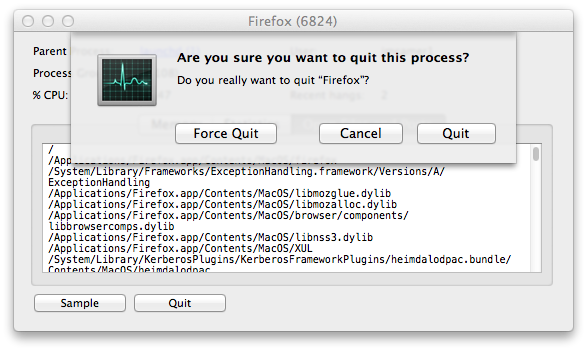
If you wish to kill the process, you can terminate it by clicking on the Quit button on the details window for the process. You will be asked "Are you sure you want to quit this process?" and will have the choice of clicking on Force Quit, Cancel, or Quit. The Force Quit option can be used if the Quit option, which would result in a more graceful termination, doesn't work.
You can also monitor the memory and CPU usage for the system
from a shell prompt if you prefer checking from a command line
interface (CLI), by using the top command. You can
provide arguments to the command to order the displayed results.
E.g., if I want to order the results by CPU utilization, I can use
top -o cpu as shown below. The display will continually
update until you stop it with control-C.
$ top -o cpu

Processes: 186 total, 2 running, 5 stuck, 179 sleeping, 853 threads   10:33:52
Load Avg: 1.47, 1.51, 1.32  CPU usage: 21.81% user, 18.51% sys, 59.67% idle
SharedLibs: 61M resident, 0B data, 10M linkedit.
MemRegions: 72523 total, 1440M resident, 47M private, 998M shared.
PhysMem: 992M wired, 1547M active, 1537M inactive, 4076M used, 20M free.
VM: 411G vsize, 1282M framework vsize, 50382776(1) pageins, 23061999(0) pageout
Networks: packets: 30868631/12G in, 34898320/21G out.
Disks: 46048592/1135G read, 18991911/603G written.

PID    COMMAND      %CPU      TIME     #TH   #WQ   #POR #MREGS RPRVT  RSHRD
107    WindowServer 22.6      29:46:30 4     1     751  30114- 31M-   213M
6822   top          16.2      04:51.22 1/1   0     41   36     2444K  216K
6824   firefox      11.0      04:11.95 45    1     232  1909   381M+  83M
81474- Microsoft En 4.9       04:17:47 14    3     378  1647   86M    69M
364    Console      4.8       69:48.98 6     5     115+ 187+   11M+   6932K
811    Terminal     3.9       28:56.24 9     4     254  974    42M    11M
485-   Microsoft Da 3.5       02:04:35 3     1     108  225    41M    17M
0      kernel_task  2.8       12:20:59 82/2  0     2    1069   40M    0B
6874   activitymoni 2.0       00:09.72 1     0     23   29     1660K  216K
15477  soffice      1.2       10:46:01 6     3     107  578    1956K  5096K
6871   Activity Mon 1.2       00:07.22 3     2     121+ 153+   5344K+ 7068K
360    Network Util 1.1       05:30:32 2     1     118  135    3128K  10M
346    distnoted    0.8       05:28:20 6     5     173  51     5304K  1052K
437-   My Day       0.3       02:58:31 6     1     169  398    15M    28M
46396- Microsoft Po 0.2       89:47.64 5     3     158  1194   12M    49M
65041  storeagent   0.2       03:37.32 5     2     103+ 100+   2292K+ 3384K
25     distnoted    0.1       01:44:48 5     4     120  45     1288K  1052K
363-   AdobeReader  0.1       60:42.53 11    4     161  673    2876K  12M
73-    LANrev Agent 0.1       44:29.08 14    3     323+ 95+    4412K+ 1592K
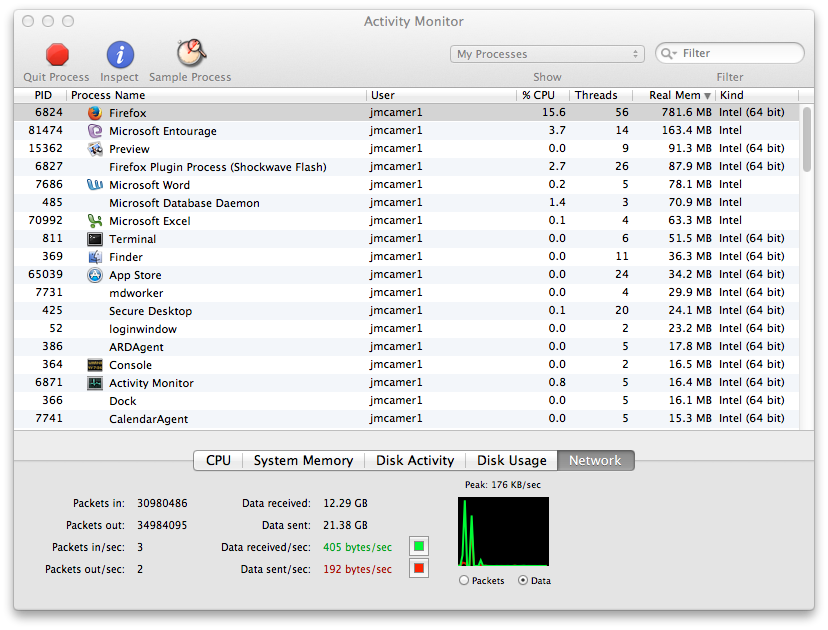
The Activity Monitor program can also be used to monitor network bandwidth utilization, if you click on the Network tab near the bottom of its window. You will see figures on data and packets received and sent and a small graph that is constantly updated showing the bandwidth being used on the network.
You can also use the Network Utility to monitor network utilization.
![]()
Created: Friday June 26 2015