
Gnuplot
is a command-line interface (CLI) program that can be used to
create two and three-dimensional plots on a variety of operating systems
including
Linux, OS
X/macOS,
Unix, and Microsoft Windows systems. If you use
CentOS Linux,
you can install it with the
yum package management utility with yum install
gnuplot. The information shown below is for the gnuplot 4.6.2 package
on a CentOS system.
$ rpm -qi gnuplot
Name        : gnuplot
Version     : 4.6.2
Release     : 3.el7
Architecture: x86_64
Install Date: Fri 23 Feb 2018 09:30:00 PM EST
Group       : Applications/Engineering
Size        : 1551543
License     : gnuplot and MIT
Signature   : RSA/SHA256, Thu 03 Jul 2014 09:41:15 PM EDT, Key ID 24c6a8a7f4a80eb5
Source RPM  : gnuplot-4.6.2-3.el7.src.rpm
Build Date  : Tue 10 Jun 2014 12:07:58 AM EDT
Build Host  : worker1.bsys.centos.org
Relocations : (not relocatable)
Packager    : CentOS BuildSystem <http://bugs.centos.org>
Vendor      : CentOS
URL         : http://www.gnuplot.info/
Summary     : A program for plotting mathematical expressions and data
Description :
Gnuplot is a command-line driven, interactive function plotting
program especially suited for scientific data representation.  Gnuplot
can be used to plot functions and data points in both two and three
dimensions and in many different formats.

Install gnuplot if you need a graphics package for scientific data
representation.
$
Once you've installed the software on a Linux system, you can start
the program by typing gnuplot and hitting Enter. You
will get a gnuplot prompt where you can type commands, e.g., help
for information on using the program. You can terminate the program by typing
exit at the prompt.
$ gnuplot

        G N U P L O T
        Version 4.6 patchlevel 2    last modified 2013-03-14
        Build System: Linux x86_64

        Copyright (C) 1986-1993, 1998, 2004, 2007-2013
        Thomas Williams, Colin Kelley and many others

        gnuplot home:     http://www.gnuplot.info
        faq, bugs, etc:   type "help FAQ"
        immediate help:   type "help"  (plot window: hit 'h')

Terminal type set to 'x11'
gnuplot> exit
$
What follows is a brief tutorial on using the gnuplot program to create some
basic graphs. To have the utility plot data from a text file you can type
plot filename, where filename is the name
of the file containing the data to be plotted at the gnuplot prompt. E.g.,
suppose I have a file named impressions.txt
containing data for the month of January 2018 as shown below.
163
421
445
487
467
207
154
446
312
15
489
544
235
215
510
637
589
656
424
246
232
660
604
668
662
334
334
294
473
705
545
I could plot the data by typing plot "impresions.txt" at
the gnuplot prompt. Be sure to enclose the file name in quotes. If you don't,
you will see an error message like the following one.
gnuplot> plot impressions.txt
         undefined variable: impressions

gnuplot>
If the current working directory isn't the one where the file resides, include the directory path before the file name. If you don't include the directory path and the file isn't present in the current directory, you will see an error message like the one below.
gnuplot> plot "all_impressions.txt"
         warning: Skipping unreadable file "all_impressions.txt"
         No data in plot

gnuplot>
If I use plot "impressions.txt", I will see the following
graph displayed, if I am directly logged into the host on which I'm running
the command or have connected via the
Secure
Shell (SSH) protocol by specifying the -X option (use a
capital letter "X") when logging in from a system that supports the
X Window
System, aka X11, since that enables X11 forwarding. E.g., ssh -X
jdoe@example.com.

The display above displays the entries in the data file as points in
the plot. But I think the data is easier to visualize in this case if a line
is drawn through the points. I can use plot "impressions.txt" with
linespoints to have gnuplot draw a line through the points.

Or, if I just want to see a line without the points, I can use
plot "impressions.txt" with lines to have gnuplot display a line
without the points.

If you want to change the line color from the default value, you can use a command like the one below.
gnuplot> plot "impressions.txt" with lines linecolor rgb "green"
You can specify the color as a word, such as "green" or "black" or as
an RGB value
in
hexadecimal - see
HTML color names. E.g., I could use plot
"impressions.txt" with lines linecolor rgb "#800080" to have the data
displayed with a purple line.

In each case, gnuplot displays the name of the file from which the data was extracted in the upper, right-hand corner of the screen where it also displays the type of plot, e.g., points, a line with the points of data shown, or just a line. There were 31 entries in the data file and gnuplot shows values on the x-axis starting at 0 and going to 30, which covers 31 values. The y-axis of the graph goes from 0 to 800 to accomodate the range of values in the data, which range from 15 to 705.
Another option I could use for visualizing the data, which will produce
a slightly different display for the values on the x-axis, i.e., from -5 to
35, is plot "impressions.txt" with boxes to display vertical
boxes
showing the variations in the data.

You can also have the boxes drawn with a fill color. E.g., to have the
boxes appear as solid boxes with the default color, I could use
plot "impressions.txt" with boxes fillstyle solid or I could
shorten "fillstyle" to "fs", i.e., plot "impressions.txt" with boxes fs
solid.

You can also control the "density" of the color pattern used to fill the
boxes. The density value is specified after "fillstyle solid" and can range
from 0 to 1.0. The density has a default value of 1. Below is an example of
the density being set to half the default value with plot
"impressions.txt" with boxes fs solid 0.5.

A data file can contain multiple columns. The above data file contained a list of ad impressions for a website from January 1 through January 31, 2018. Instead of just having the values listed sequentially in the file, I might have a file, dated_impressions.txt that contains lines starting with the date in the form month/day/year followed by a space and then the number of impressions for that date. I.e.:
01/01/2018 163 01/02/2018 421 01/03/2018 445 01/04/2018 487 01/05/2018 467 01/06/2018 207 01/07/2018 154 01/08/2018 446 01/09/2018 312 01/10/2018 15 01/11/2018 489 01/12/2018 544 01/13/2018 235 01/14/2018 215 01/15/2018 510 01/16/2018 637 01/17/2018 589 01/18/2018 656 01/19/2018 424 01/20/2018 246 01/21/2018 232 01/22/2018 660 01/23/2018 604 01/24/2018 668 01/25/2018 662 01/26/2018 334 01/27/2018 334 01/28/2018 294 01/29/2018 473 01/30/2018 705 01/31/2018 545
When gnuplot produces a graph from the data, I want the dates displayed
beneath the x-axis. To do so, I need to tell gnuplot that the "xdata" contains
time values, which I can do with set xdata time; if the y-axis
would be used for time values, you could use set ydata time. I
also need to tell gnuplot how the time values are represented in the data. In
this case they are in the form month/day/year where the year is a 4-digit
value and with the different parts of the date separated by forward slashes.
But the dates could have been a different format, e.g., year-month-date with
dashes separating the different parts of the date. The commonly used
format for dates can vary by country. For the dates in this
file I can use the command set timefmt "%m/%d/%Y". The uppercase
"Y" indicates the year is represented by 4 digits rather than 2. If only 2
were used, I'd use a lowercase "y", instead. I put forward slashes between
the parts of the date as that is how they are separated in the data and I use
%d for day and %m for month. I also need to inform
gnuplot that I want it to use 2 columns from the data file not just one. I
can do that by specifying using 1:2, i.e., I want it to use
the columns starting at the first column and ending at the second column. I can
use the commands below to create the plot I want to see.
gnuplot> set xdata time gnuplot> set timefmt "%m/%d/%Y" gnuplot> plot "dated_impressions.txt" using 1:2 with linespoints gnuplot>
I would then see the below plot.

But I don't need to see the year displayed beneath the tick marks on
the x-axis. If I wanted just the month and day to be used with a slash
between the month and day, I could use the command set format x
"%m/%d". And, if I want to display a title for the plot I can add
title "January 2018" to the plot command. E.g.:
gnuplot> set xdata time gnuplot> set timefmt "%m/%d/%Y" gnuplot> set format x "%m/%d" gnuplot> plot "dated_impressions.txt" using 1:2 title "January 2018" with linespoints gnuplot>
I would then see the title I specified in the upper, right-hand corner of the plot rather than the filename used for the data.

In all of the examples above, I was connected to a CentOS Linux server
on which the data file resides and was using an SSH command like
ssh -X jdoe@example.com to establish the connection to that
server from another Linux system. I captured the plots to a file by
taking a screenshot with
GIMP on the SSH client system. But often I might be connected
from a Windows system which doesn't have any application installed that
supports X11 or for another reason I may want the output of gnuplot to go
directly to a file. Fortunately, gnuplot supports a number of different
ways to output the results for a plot. The default output is usually an
X11 terminal. You can see that default value when you start gnuplot. The
last line displayed prior to the gnuplot prompt being displayed may show
Terminal type set to 'x11', but you can change that setting
by a set terminal command.
$ gnuplot

	G N U P L O T
	Version 4.6 patchlevel 2    last modified 2013-03-14
	Build System: Linux x86_64

	Copyright (C) 1986-1993, 1998, 2004, 2007-2013
	Thomas Williams, Colin Kelley and many others

	gnuplot home:     http://www.gnuplot.info
	faq, bugs, etc:   type "help FAQ"
	immediate help:   type "help"  (plot window: hit 'h')

Terminal type set to 'x11'
gnuplot>
You can see the options for terminal type by typing "help set terminal" at the gnuplot prompt.
gnuplot> help set terminal
 `gnuplot` supports many different graphics devices.  Use `set terminal` to
 tell `gnuplot` what kind of output to generate. Use `set output` to redirect
 that output to a file or device.

 Syntax:
       set terminal {<terminal-type> | push | pop}
       show terminal

 If <terminal-type> is omitted, `gnuplot` will list the available terminal
 types.  <terminal-type> may be abbreviated.

 If both `set terminal` and `set output` are used together, it is safest to
 give `set terminal` first, because some terminals set a flag which is needed
 in some operating systems.

 Some terminals have many additional options.
 The options used by a previous invocation `set term <term> <options>` of a
 given `<term>` are remembered, thus subsequent `set term <term>` does
 not reset them.  This helps in printing, for instance, when switching
 among different terminals---previous options don't have to be repeated.

 The command `set term push` remembers the current terminal including its
Press return for more:
 settings while `set term pop` restores it. This is equivalent to `save term`
 and `load term`, but without accessing the filesystem. Therefore they can be
 used to achieve platform independent restoring of the terminal after printing,
 for instance. After gnuplot's startup, the default terminal or that from
 `startup` file is pushed automatically. Therefore portable scripts can rely
 that `set term pop` restores the default terminal on a given platform unless
 another terminal has been pushed explicitly.

 For more information, see the `complete list of terminals`.


Subtopics available for set terminal:
    cairolatex        canvas            cgm               context
    corel             dumb              dxf               eepic
    emf               emtex             epscairo          epslatex
    fig               gif               gpic              hp2623a
    hp2648            hpgl              imagen            jpeg
    latex             lua               mf                mif
    mp                pcl5              pdfcairo          png
    pngcairo          pop               postscript        pslatex
    pstex             pstricks          push              qms
    regis             svg               tek40xx           tek410x
    texdraw           tgif              tikz              tkcanvas
Press return for more:
    tpic              vttek             x11               xlib
    xterm

Subtopic of set terminal:
One advantage of using the X11 terminal type is that you can move the mouse pointer around on the display and see coordinates displayed at the bottom, left-hand side of the plot window as you move the mouse. E.g., in the example below, when I move the pointer near the point for January 13, I can see the value is close to 235 at that point on the graph.

To output the graph to an image file you could use set terminal
gif, set terminal jpeg, set terminal png, or
set terminal svg, etc. to set the image format to be in
Graphics
Interchange Format (GIF), Joint Photographhics Experts Group (JPEG),
Portable Network Graphics (PNG) or
Scalable Vector Graphics (SVG) format, etc.
If you want more information on a particular type, say
Portable Network Graphics (PNG), you could type
help set terminal png at the prompt.
gnuplot> help set terminal png
 Syntax:
       set terminal png
              {{no}enhanced}
              {{no}transparent} {{no}interlace}
              {{no}truecolor} {rounded|butt}
              {linewidth <lw>} {dashlength <dl>}
              {tiny | small | medium | large | giant}
              {font "<face> {,<pointsize>}"} {fontscale <scale>}
              {size <x>,<y>} {{no}crop}
              {background <rgb_color>}

 PNG, JPEG and GIF images are created using the external library libgd.
 PNG plots may be viewed interactively by piping the output to the
 'display' program from the ImageMagick package as follows:
                set term png
                set output '| display png:-'
 You can view the output from successive plot commands interactively by typing
 <space> in the display window.  To save the current plot to a file,
 left click in the display window and choose `save`.

 `transparent` instructs the driver to make the background color transparent.
 Default is `notransparent`.
Press return for more:

 `interlace` instructs the driver to generate interlaced PNGs.
 Default is `nointerlace`.

 The `linewidth` and `dashlength` options are scaling factors that affect all
 lines drawn, i.e. they are multiplied by values requested in various drawing
 commands.

 By default output png images use 256 indexed colors. The `truecolor` option
 instead creates TrueColor images with 24 bits of color information per pixel.
 Transparent fill styles require the `truecolor` option. See `fillstyle`.
 A transparent background is possible in either indexed or TrueColor images.

 `butt` instructs the driver to use a line drawing method that does
 not overshoot the desired end point of a line.  This setting is only
 applicable for line widths greater than 1.  This setting is most useful when
 drawing horizontal or vertical lines.  Default is `rounded`.

 The details of font selection are complicated.
 Two equivalent simple examples are given below:
      set term png font arial 11
      set term png font "arial,11"
Press return for more:
 For more information please see the separate section under `fonts`.

 The output plot size <x,y> is given in pixels---it defaults to 640x480.
 Please see additional information under `canvas` and `set size`.
 Blank space at the edges of the finished plot may be trimmed using the `crop`
 option, resulting in a smaller final image size. Default is `nocrop`.


gnuplot>
So, to produce a PNG file for a plort, I could use commands like the ones below.
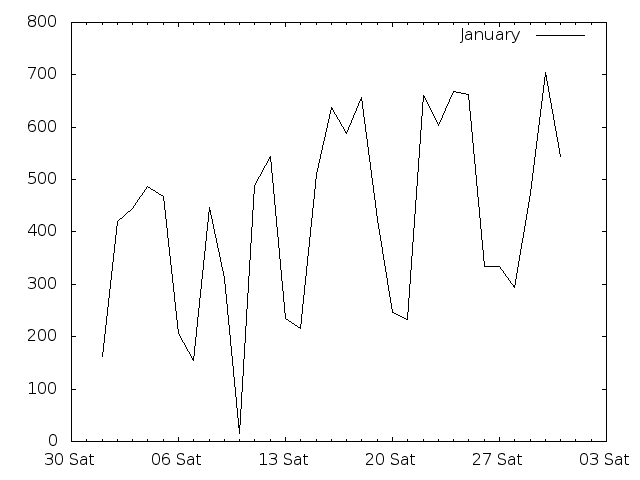
gnuplot> set xdata time
gnuplot> set timefmt "%m/%d/%Y"
gnuplot> set format x "%d %a"
gnuplot> set terminal png
Terminal type set to 'png'
Options are 'nocrop font "/usr/share/fonts/dejavu/DejaVuSans.ttf,12" fontscale 1.0 size 640,480 '
gnuplot> set output "impressions.png"
gnuplot> plot "dated_impressions.txt" using 1:2 title "January" with lines linecolor rgb "black"
gnuplot> set output
gnuplot>
When I used the command set terminal png, I saw that the
default value to be used for the size of the image is 640
pixels wide and
480 pixels wide. I then set the name for the output file to be
impressions.png. Since I didn't specify the
directory path with the file name, the output file will be placed in the
current working directory. I then issued a plot command to use the first two
columns in the dated_impressions.txt file
for the plot data and to put a title of "January" in the upper, right-hand
corner of the output file. The data will be plotted as a line graph with a
black line. Since I used set format x "%d %a" to specify how
I wanted the tick marks on the x-axis to be labelled, they will be labelled
with the day of the month followed by a space and then the day of the week
since %a represents the locale's abbreviated weekday name, e.g.,
Sun through Mon. For the full weekday name, e.g., Sunday, I could use an
uppercase "A" rather than a lowercase "a". I chose to add the weekday name
since I can see there are periodic dips in the amount of
impressions each day since that makes it clearer
that those dips occur on weekends when there is les traffic to the
site. January 10 is an anomalous data point with only 15 impressions that
day because the system was inaccessible a large portion of that day. You
can see other options for displaying time and dates at
Timefmt and
HowTo Format Date For Display or Use In a Shell Script.
If I would like to change the dimensions of the image produced, I can
specify the image dimensions in pixels by putting the dimensions at the end of
a set term command ("term" can be used as a shorthand for
"terminal"), e.g. set term png size 800,600 to set the size
to be 800 pixels wide and 600 pixels high.
gnuplot> set term png size 800,600
Terminal type set to 'png'
Options are 'nocrop font "/usr/share/fonts/dejavu/DejaVuSans.ttf,12" fontscale 1.0 size 800,600 '
gnuplot> set output "impressions_800x600.png"
gnuplot> replot
gnuplot>
In the above example, I didn't issue another plot command, but, instead
issued a replot command. The
impressions_800x600.png file will be created using the last plot command
and any subsequently modified parameters altered with the set command.
gnuplot> help replot
 The `replot` command without arguments repeats the last `plot` or `splot`
 command.  This can be useful for viewing a plot with different `set` options,
 or when generating the same plot for several devices.

 Arguments specified after a `replot` command will be added onto the last
 `plot` or `splot` command (with an implied ',' separator) before it is
 repeated.  `replot` accepts the same arguments as the `plot` and `splot`
 commands except that ranges cannot be specified.  Thus you can use `replot`
 to plot a function against the second axes if the previous command was `plot`
 but not if it was `splot`.

 N.B.---use of

       plot '-' ; ... ; replot

 is not recommended, because it will require that you type in the data all
 over again.  In most cases you can use the `refresh` command instead, which
 will redraw the plot using the data previously read in.

 Note that `replot` does not work in `multiplot` mode, since it reproduces
 only the last plot rather than the entire screen.

Press return for more:
 See also `command-line-editing` for ways to edit the last `plot` (`splot`)
 command.

 See also `show plot` to show the whole current plotting command, and the
 possibility to copy it into the `history`.

gnuplot>
Or, if I want to produce a PDF file, I might use a command
like set term pdf size 10cm,10cm to set the size in
centimeters.
gnuplot> set term pdf
Terminal type set to 'pdfcairo'
Options are ' transparent fontscale 0.5 size 5.00in, 3.00in '
gnuplot> set output "impressions_10cmx10cm.pdf"
gnuplot> replot
gnuplot> set output
gnuplot>
gnuplot>
I put the command set output after replot to
ensure that all data is written to the output file and the file is properly
closed. The above commands in conjunction with the previously issued set
commands would produce the file
impressions_10cmx10cm.pdf. You can reset values to default values by
typing reset and hitting Enter at a gnuplot prompt.
