Wireshark - bandwidth usage and bytes by protocol
The
free and open source
packet analysis
tool Wireshark provides
many capabilities for analyzing network traffic. Among its capabilities is
the capability to provide statistical information regarding captured network
traffic. Looking at a pcap
file with Wireshark for traffic captured during a data flow test, I saw what
seemed to be a fair amount of
Simple Network Management Protocol (SNMP) and
Secure Shell (SSH)
traffic with systems on an external network. I wanted to determine the
actual percentage that traffic represented within the overall traffic during
the test period. Fortunately, that is easy to do within Wireshark. One way to
view statistics on bandwidth utilization by protocol while viewing
captured data is by clicking on Statistics then selecting Protocol
Hierarchy. Note: you may need to wait a little while for the statistics
to be displayed if the amount of data to be processed is large.
[ More
Info ]
[/network/tools/sniffing/wireshark]
permanent link
Creating a Filter to Display HTTP Cookies
To create a filter to display
HTTP cookies in
Wireshark, take the
following steps:
-
Open Wireshark and click on Analyze.
-
Select Display Filters.
-
Click on New.
-
For filter name, type
HTTP cookie or whatever name you would
like and for filter string type http.cookie.
-
Click on OK. You should then see only the packets containing
HTTP cookies displayed.
Note: written for Wireshark 1.8.4, but should apply to other versions
as well.
References:
-
cookie and query strings
Wireshark Q&A
[/network/tools/sniffing/wireshark]
permanent link
Installing Wireshark 1.8.4 and WinPcap 4.1.2 on a Windows 8 System
I installed Wireshark 1.8.4. When I started it, I was
informed that I hadn't specified an interface on which to perform a
capture. When I tried specifying an interface, I was informed there were
no interfaces on which a capture could be done. I saw "(Unable to load
WinPcap (wpcap.dll); you will not be able to capture packets."
I needed to install WinPcap in order
to utilize Wireshark, so I downloaded
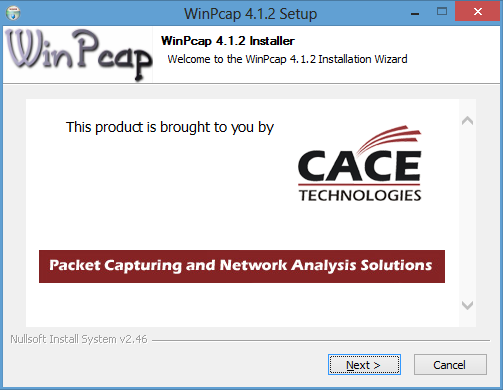
WinPcap 4.1.2. When I ran
the installation program, a Program Compatibility Assistant
window opened stating "This program has compatibility issues." There
were two options: (1) Get help online and (2) Run the program without
getting help. I chose the latter. That resulted in a WinPcap 4.1.2
Setup window opening with the message "This version of Windows is
not supported by WinPcap 4.1.2. The installation will be aborted."
To resolve the problem, the following steps can be taken.
- Right-click on the installation file,
WinPcap_4_1_2.exe and select Properties.
- Click on the Compatibility tab.
-
Check the box next to "Run this program in compatibility mode for" and select
"Windows 7".
- Check the box for "Run this program as an administrator"
under Privilege level.
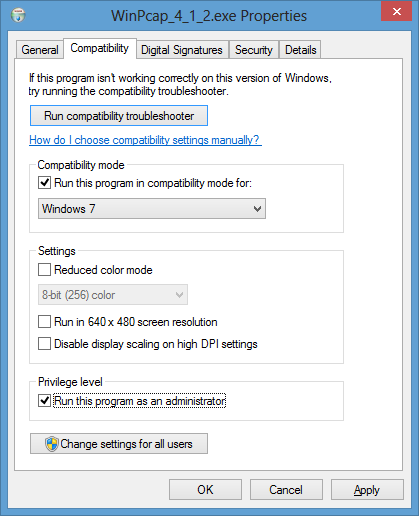
- Click on the OK button.
-
Run the installation program again and allow it to make changes to the system.
-
When the Program Compatibility Assistant window opens informing
you that "This program has compatibility issues", select "Run the program
without getting help". The WinPcap 4.1.2 Setup window should
then open allowing you to proceed with the installation.
References:
-
[Winpcap-users] Windows 8
By Andrew Stewart
Date: July 6, 2012
WinPcap
-
Installing WIRESHARK/WinPCap on Windows 8 RTM
By Kaushal Kumar
Panday
Date: August 7, 2012
Unleashed
[/network/tools/sniffing/wireshark]
permanent link
Installing Wireshark
I wanted to install Ethereal on a CentOS Linux system to sniff network traffic
to try to resolve a problem for a website. I have
tcpdump on the system,
but I wanted to have a
GUI
tool to make analyzing the packets a little easier for me.
I ran yum install ethereal, which installed wireshark
and its dependency, libsmi. Wireshark was installed, because
development of ethereal has stopped and the core development team is now
developing wireshark.
The FAQ for
wireshark offers the following explanation of the name change.
In May of 2006, Gerald Combs (the original author of Ethereal) went
to work for CACE Technologies (best known for WinPcap). Unfortunately,
he had to leave the Ethereal trademarks behind.
This left the project in an awkward position. The only reasonable way to
ensure the continued success of the project was to change the name. This
is how Wireshark was born.
Wireshark is almost (but not quite) a fork. Normally a "fork" of an
open source project results in two names, web sites, development teams,
support infrastructures, etc. This is the case with Wireshark except for
one notable exception -- every member of the core development team is now
working on Wireshark. There has been no active development on Ethereal
since the name change. Several parts of the Ethereal web site (such as the
mailing lists, source code repository, and build farm) have gone offline.
After the installation completed, I tried running wireshark by issuing
the command wireshark.
# wireshark
bash: wireshark: command not found
I then discovered that installing the wireshark
RPM only installs
a command line program, tshark. The program was installed in
/usr/sbin/tshark. You can obtain help on
tshark using man tshark or tshark -h.
There is also documentation installed in /usr/share/wireshark/help.
I had to install wireshark-gnome to get the GUI version, which
I did with yum -y install wireshark-gnome. I could then start
the GUI version from a shell prompt with wireshark or start it
by clicking on Applications, Internet, and then
Wireshark Network Analyzer.
Since I wanted to capture only HTTP
traffic, I typed HTTP in the Filter field and
then clicked on the Apply button. I then clicked on Capture,
Interfaces, and clicked on the Start button next to the
eth0 interface to start capturing all HTTP traffic.
[/network/tools/sniffing/wireshark]
permanent link