
If you are using an Apple system running the OS X operating system and find that it is running slowly, you can check memory and CPU utilization using the Activity Monitor application that comes with the operating system. You can find the program under Applications/Utilities.
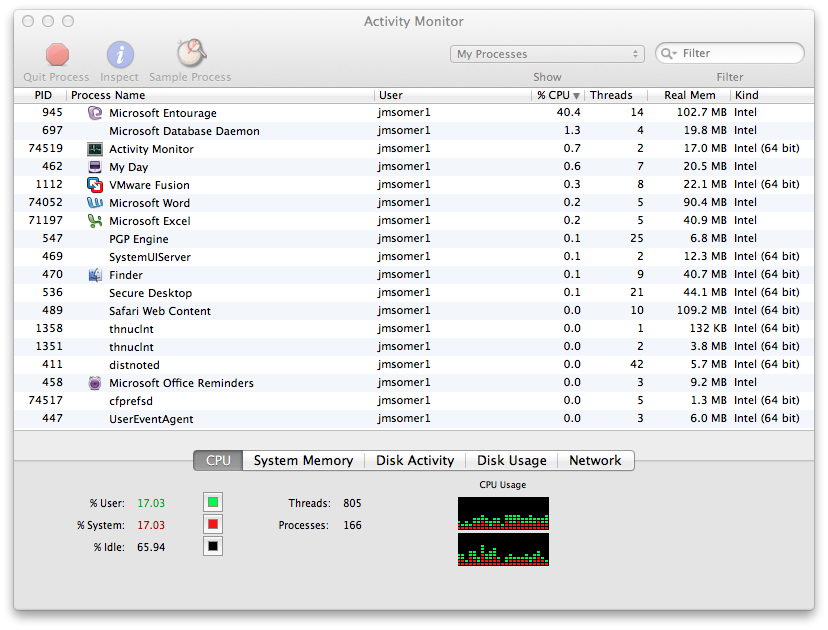
If you wish to see which application is using the greatest amount of memory, you can click on the Real Mem column header to display the list of processes running on the system ordered by memory utilization. To order the list by the percentage of CPU utilization, you can click on the % CPU column header to see which application is most heavily using the CPU.
In the example below, Entourage is using 40.4% of CPU cycles and 102.7 megabytes of memory.
Another utility that comes with the OS X operating system which you can
use to check on the resources used by applications is the top
utility which can be run from a shell prompt, which you can get by running
the Terminal program found in Applications/Utilities. You will
get a text display that provides information on system performance by
running the top command. The command top -o cpu
will order the displayed list of running processes by CPU utilization.
Processes: 165 total, 3 running, 13 stuck, 149 sleeping, 718 threads   22:04:55
Load Avg: 1.50, 2.52, 2.81  CPU usage: 25.11% user, 22.83% sys, 52.5% idle
SharedLibs: 796K resident, 0B data, 0B linkedit.
MemRegions: 30234 total, 1308M resident, 45M private, 1267M shared.
PhysMem: 1691M wired, 1196M active, 1187M inactive, 4074M used, 21M free.
VM: 335G vsize, 1026M framework vsize, 4076678(0) pageins, 3624731(0) pageouts.
Networks: packets: 6273654/3871M in, 5724447/3985M out.
Disks: 7453865/220G read, 6472245/405G written.

PID    COMMAND      %CPU TIME     #TH  #WQ  #PORTS #MREG RPRVT  RSHRD  RSIZE
945-   Microsoft En 77.5 14:43:34 14/1 4    258    1288+ 69M+   38M    99M+
90973  top          8.0  00:02.45 1/1  0    24     30    1280K  216K   2028K
697-   Microsoft Da 2.0  27:09.14 3    1    105    199   39M    5892K  41M
1329   vmware-vmx   1.6  09:41:27 15   1    260    555   4704K  47M    956M+
0      kernel_task  1.4  01:57:04 88/2 0    2      652   65M    0B     411M
456    Terminal     0.4  00:29.01 5    1    147    229   7556K  7192K  16M
87     WindowServer 0.4  01:43:11 4    1    547    4074  13M    88M    56M+
74-    AgentService 0.1  08:47:21 8    1    89     103   1436K  1384K  2928K
489    WebProcess   0.1  03:18:09 10   1    266-   2738- 96M+   121M   183M+
462-   My Day       0.1  09:51.57 7    2    171    340-  11M-   14M    18M-
49     mds          0.1  32:49.92 7    5    284-   397   36M-   3176K  63M-
74052- Microsoft Wo 0.1  00:27.20 4    2    163    630   9892K  22M    17M
71197- Microsoft Ex 0.1  00:49.76 5    3    153    517   7832K  79M    17M
187-   SymAutoProte 0.0  15:55.03 8    1    74-    227-  21M-   2060K
The list of processes above has Microsoft Entourage at the top at 77.5 %CPU.
